Interface VisualSets
-
Nested Class Summary
Nested ClassesModifier and TypeInterfaceDescriptionstatic enumDisplay mode for the Box-and-Whisker plot. -
Method Summary
Static MethodsModifier and TypeMethodDescriptionstatic <T> BoxAndWhiskerVisualSet<T> boxAndWhisker(String name, Supplier<List<T>> elements, Function<T, String> textExtractor, Function<T, DistributionStatistics> statisticsExtractor) Creates aBoxAndWhiskerVisualSetwith the specified name, data elements, and extractors.static <T> BoxAndWhiskerVisualSet<T> boxAndWhisker(String name, Supplier<List<T>> elements, Function<T, String> textExtractor, Function<T, DistributionStatistics> statisticsExtractor, VisualSets.BoxAndWhiskerDisplayMode mode) Creates aBoxAndWhiskerVisualSetwith the specified name, data elements, extractors, and display mode.static LineVisualSet<Pair<Double, Double>> cumulativeLine(String name, ITimeStatistics timeStatistics) static <E extends Slot>
SlotsVisualSet<E> static <E extends Slot>
SlotsVisualSet<E> gantt(String name, GanttChartRow row, Sequence<E> sequence) static <E extends Interval>
SlotsVisualSet<E> gantt(String name, GanttChartRow row, Supplier<List<E>> slotsSupplier) static <E extends Interval>
SlotsVisualSet<E> gantt(String name, GanttChartRow row, List<E> slots) static <E extends Interval>
SlotsVisualSet<E> static <E extends Interval>
SlotsVisualSet<E> ganttPiecewisePolyline(String name, GanttChartRow ganttChartRow, Supplier<PiecewiseFunction> piecewiseFunctionExtractor, Supplier<Pair<Double, Double>> displayedRangeExtractor, Supplier<Double> axisLengthInPixelsExtractor) Constructs a GanttPiecewiseLineVisualSet with given name, piecewiseFunction extractor and discretization rule extractors.ganttPiecewisePolyline(String name, GanttChartRow ganttChartRow, Supplier<PiecewiseFunction> piecewiseFunctionExtractor, Supplier<Double> currentArgumentExtractor, Supplier<Pair<Double, Double>> displayedRangeExtractor, Supplier<Double> axisLengthInPixelsExtractor) Constructs a GanttPiecewiseLineVisualSet with given name, piecewiseFunction extractor and discretization rule extractors.ganttPiecewisePolyline(String name, Supplier<PiecewiseFunction> piecewiseFunctionExtractor, Supplier<Pair<Double, Double>> displayedRangeExtractor, Supplier<Double> axisLengthInPixelsExtractor) Constructs a GanttPiecewiseLineVisualSet with given name, piecewiseFunction extractor and discretization rule extractors.ganttPiecewisePolyline(String name, Supplier<PiecewiseFunction> piecewiseFunctionExtractor, Supplier<Double> currentArgumentExtractor, Supplier<Pair<Double, Double>> displayedRangeExtractor, Supplier<Double> axisLengthInPixelsExtractor) Constructs a GanttPiecewiseLineVisualSet with given name, piecewiseFunction extractor and discretization rule extractors.static GanttPolylineVisualSet<Pair<Double, Double>> ganttPolyline(String name, RatePlanner ratePlanner) static GanttPolylineVisualSet<Pair<Double, Double>> ganttPolyline(String name, GanttChartRow row, RatePlanner ratePlanner) static GanttPolylineVisualSet<Pair<Double, Double>> ganttPolyline(String name, GanttChartRow row, Color color, List<Pair<Double, Double>> list) static GanttPolylineVisualSet<Pair<Double, Double>> ganttPolyline(String name, GanttChartRow row, Supplier<List<Pair<Double, Double>>> list) static GanttPolylineVisualSet<Pair<Double, Double>> ganttPolyline(String name, GanttChartRow row, List<Pair<Double, Double>> list) static GanttPolylineVisualSet<Pair<Double, Double>> static GanttPolylineVisualSet<Pair<Double, Double>> static <E> HeatmapVisualSet<E> heatmap(String name, Supplier<List<E>> elements, Function<E, String> xAxisCategoryExtractor, Function<E, String> yAxisCategoryExtractor) static <O,T extends HistogramDataAggregator<C, O>.HistogramDataGroup, C>
HistogramVisualSet<T, C> histogram(String name, HistogramDataAggregator<C, O> aggregator) static <O,T extends HistogramDataAggregator<C, O>.HistogramDataGroup, C>
HistogramVisualSet<T, C> histogram(String name, HistogramDataAggregator<C, O> aggregator, boolean cleanEmptyGroups) static <O,T extends HistogramDataAggregator<C, O>.HistogramDataGroup, C>
HistogramVisualSet<T, C> histogram(String name, HistogramDataAggregator<C, O> aggregator, HistogramVisualSet.ExtractValuePolicy extractValuePolicy) static <O,T extends HistogramDataAggregator<C, O>.HistogramDataGroup, C>
HistogramVisualSet<T, C> histogram(String name, HistogramDataAggregator<C, O> aggregator, HistogramVisualSet.ExtractValuePolicy extractValuePolicy, boolean cleanEmptyGroups) static <T extends HistogramDataAggregator<String,T>.HistogramDataGroup>
HistogramVisualSet<T, String> histogram(String name, org.apache.commons.math3.distribution.RealDistribution realDistribution, int barsCount) static LineVisualSet<Pair<Double, Double>> line(String name, ITimeStatistics timeStatistics) Creates an instance ofLineVisualSetwith the specified name from the providedITimeStatistics.static LineVisualSet<Pair<Double, Double>> line(String name, ITimeStatistics timeStatistics, boolean interpolateEmptyBuckets) Creates an instance ofLineVisualSetwith the specified name and interpolation rule for empty buckets, from the providedITimeStatistics.static LineVisualSet<Pair<Double, Double>> line(String name, ITableFunction tableFunction) Creates an instance ofLineVisualSetwith the specified name and step interpolation from the providedITableFunction.static LineVisualSet<Pair<Double, Double>> Creates an instance ofLineVisualSetwith the specified name from the provided supplier of list of argument-value pairs (instancesPair) of Double values.static LineVisualSet<Pair<Double, Double>> Creates an instance ofLineVisualSetwith the specified name from the provided list of argument-value pairs (instancesPair) of Double values.static LineBarVisualSet<Pair<Double, Double>> lineBar(String name, ITimeStatistics timeStatistics) Creates an instance ofLineBarVisualSetwith the specified name and linear interpolation from the providedITimeStatistics.static LineBarVisualSet<Pair<Double, Double>> lineBar(String name, ITableFunction tableFunction) Creates an instance ofLineBarVisualSetwith the specified name and linear interpolation from the providedITableFunction.static LineBarVisualSet<Pair<Double, Double>> lineBar(String name, ITableFunction tableFunction, double granularity) Creates an instance ofLineBarVisualSetwith the specified name, linear interpolation, and specified x-axis granularity from the providedITableFunction.static <E,R> Mapping <E, R> static <E extends Slot>
RegionVisualSet<E> Creates an instance ofRegionVisualSetthat highlights X-axis regions corresponding to slots of the specifiedSequence.static <E extends Interval>
RegionVisualSet<E> Creates an instance ofRegionVisualSetthat highlights X-axis regions corresponding to time intervals contained in the provided supplier of a list.static PiecewisePolylineVisualSetpiecewisePolyline(String name, Supplier<PiecewiseFunction> piecewiseFunctionExtractor, Supplier<Pair<Double, Double>> displayedRangeExtractor, Supplier<Double> axisLengthInPixelsExtractor) Constructs a PiecewiseLineVisualSet with given name, piecewiseFunction extractor and discretization rule extractors.static PiecewisePolylineVisualSetpiecewisePolyline(String name, Supplier<PiecewiseFunction> piecewiseFunctionExtractor, Supplier<Double> currentArgumentExtractor, Supplier<Pair<Double, Double>> displayedRangeExtractor, Supplier<Double> axisLengthInPixelsExtractor) Constructs a PiecewiseLineVisualSet with given name, piecewiseFunction extractor and discretization rule extractors.static PolylineVisualSet<Pair<Double, Double>> polyline(String name, RatePlanner ratePlanner) static PolylineVisualSet<Pair<Double, Double>> static PolylineVisualSet<Pair<Double, Double>> static <T> WaterfallVisualSet<T> waterfall(String name, List<T> elements, Function<T, Double> valueExtractor, Function<T, String> textExtractor, Function<T, WaterfallVisualSet.ElementType> typeExtractor) Constructs an instance ofWaterfallVisualSetwith the specified parameters.
-
Method Details
-
period
Creates an instance ofRegionVisualSetthat highlights X-axis regions corresponding to slots of the specifiedSequence.The following example demonstrates the usage of this method:
Composite parent = ...; var sequence = new Sequence
(); sequence.insert(1, new Slot(1,3)); var lineChart = Charts.lineNumeric(parent); var periodVisualSet = VisualSets.period("Period", sequence) .setBackgroundColor(slot -> Colors.yellow); lineChart.getVisualSetContainer().addVisualSet(periodVisualSet); - create a sequence of slots;
- initialize the line chart with numeric X-Axis;
- create a region visual set with the sequence as an underlying data source;
- finally, add the visual set to the chart.

- Type Parameters:
E- type of slots of the specified sequence.- Parameters:
name- name of the created visual setsequence- an instance ofSequencethat contains the slots for which to highlight X-axis regions.- Returns:
- an instance of
RegionVisualSet
-
period
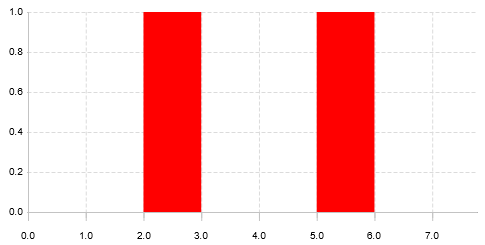
Creates an instance ofRegionVisualSetthat highlights X-axis regions corresponding to time intervals contained in the provided supplier of a list.The following example demonstrates the usage of this method:
Composite parent = ...; var timeIntervals = List.of(new TimeInterval(2, 3), new TimeInterval(5, 6)); var lineChart = Charts.lineNumeric(parent); var periodVisualSet = VisualSets.period("Period", () -> timeIntervals) .setBackgroundColor(slot -> Colors.red); lineChart.getVisualSetContainer().addVisualSet(periodVisualSet);- create a list of two time intervals;
- initialize the line chart with numeric X-Axis;
- create a region visual set with a supplier of the list as an underlying data source;
- finally, add the visual set to the chart.
- Type Parameters:
E- type of slots of the specified sequence.- Parameters:
name- name of the created visual setslots- a supplier of a list of time intervals to be highlighted X-axis regions.- Returns:
- an instance of
RegionVisualSet
-
gantt
-
gantt
-
gantt
static <E extends Slot> SlotsVisualSet<E> gantt(String name, GanttChartRow row, Sequence<E> sequence) -
gantt
-
gantt
-
gantt
static <E extends Interval> SlotsVisualSet<E> gantt(String name, GanttChartRow row, Supplier<List<E>> slotsSupplier) -
heatmap
-
polyline
-
ganttPolyline
static GanttPolylineVisualSet<Pair<Double,Double>> ganttPolyline(String name, RatePlanner ratePlanner) -
ganttPolyline
static GanttPolylineVisualSet<Pair<Double,Double>> ganttPolyline(String name, GanttChartRow row, RatePlanner ratePlanner) -
ganttPiecewisePolyline
static GanttPiecewisePolylineVisualSet ganttPiecewisePolyline(String name, Supplier<PiecewiseFunction> piecewiseFunctionExtractor, Supplier<Pair<Double, Double>> displayedRangeExtractor, Supplier<Double> axisLengthInPixelsExtractor) Constructs a GanttPiecewiseLineVisualSet with given name, piecewiseFunction extractor and discretization rule extractors.- Parameters:
name- visual set name is used to sort and name the visual sets on the chartpiecewiseFunctionExtractor- data elements list provider. The provider is invalidated every time the chart is being redrawndisplayedRangeExtractor- a function that specifies the rule for extracting a current displayed range on plotaxisLengthInPixelsExtractor- a function that specifies the rule for extracting an actual plot X-axis length in pixels
-
ganttPiecewisePolyline
static GanttPiecewisePolylineVisualSet ganttPiecewisePolyline(String name, Supplier<PiecewiseFunction> piecewiseFunctionExtractor, Supplier<Double> currentArgumentExtractor, Supplier<Pair<Double, Double>> displayedRangeExtractor, Supplier<Double> axisLengthInPixelsExtractor) Constructs a GanttPiecewiseLineVisualSet with given name, piecewiseFunction extractor and discretization rule extractors.- Parameters:
name- visual set name is used to sort and name the visual sets on the chartpiecewiseFunctionExtractor- data elements list provider. The provider is invalidated every time the chart is being redrawncurrentArgumentExtractor- a function that specifies the rule for extracting a current argument shown on plot. When working with simulation in most cases a model.time() is used as a max argument. NaN (not considered by visual set) by default.displayedRangeExtractor- a function that specifies the rule for extracting a current displayed range on plotaxisLengthInPixelsExtractor- a function that specifies the rule for extracting an actual plot X-axis length in pixels
-
ganttPiecewisePolyline
static GanttPiecewisePolylineVisualSet ganttPiecewisePolyline(String name, GanttChartRow ganttChartRow, Supplier<PiecewiseFunction> piecewiseFunctionExtractor, Supplier<Pair<Double, Double>> displayedRangeExtractor, Supplier<Double> axisLengthInPixelsExtractor) Constructs a GanttPiecewiseLineVisualSet with given name, piecewiseFunction extractor and discretization rule extractors.- Parameters:
name- visual set name is used to sort and name the visual sets on the chartganttChartRow-GanttChartRowwhich displays this visual set i.e. the Y-axis valuepiecewiseFunctionExtractor- data elements list provider. The provider is invalidated every time the chart is being redrawndisplayedRangeExtractor- a function that specifies the rule for extracting a current displayed range on plotaxisLengthInPixelsExtractor- a function that specifies the rule for extracting an actual plot X-axis length in pixels
-
ganttPiecewisePolyline
static GanttPiecewisePolylineVisualSet ganttPiecewisePolyline(String name, GanttChartRow ganttChartRow, Supplier<PiecewiseFunction> piecewiseFunctionExtractor, Supplier<Double> currentArgumentExtractor, Supplier<Pair<Double, Double>> displayedRangeExtractor, Supplier<Double> axisLengthInPixelsExtractor) Constructs a GanttPiecewiseLineVisualSet with given name, piecewiseFunction extractor and discretization rule extractors.- Parameters:
name- visual set name is used to sort and name the visual sets on the chartganttChartRow-GanttChartRowwhich displays this visual set i.e. the Y-axis valuepiecewiseFunctionExtractor- data elements list provider. The provider is invalidated every time the chart is being redrawncurrentArgumentExtractor- a function that specifies the rule for extracting a current argument shown on plot. When working with simulation in most cases a model.time() is used as a max argument. NaN (not considered by visual set) by default.displayedRangeExtractor- a function that specifies the rule for extracting a current displayed range on plotaxisLengthInPixelsExtractor- a function that specifies the rule for extracting an actual plot X-axis length in pixels
-
polyline
-
polyline
-
ganttPolyline
-
ganttPolyline
-
ganttPolyline
static GanttPolylineVisualSet<Pair<Double,Double>> ganttPolyline(String name, GanttChartRow row, List<Pair<Double, Double>> list) -
ganttPolyline
-
ganttPolyline
-
histogram
static <O,T extends HistogramDataAggregator<C, HistogramVisualSet<T,O>.HistogramDataGroup, C> C> histogram(String name, HistogramDataAggregator<C, O> aggregator) -
histogram
static <O,T extends HistogramDataAggregator<C, HistogramVisualSet<T,O>.HistogramDataGroup, C> C> histogram(String name, HistogramDataAggregator<C, O> aggregator, boolean cleanEmptyGroups) -
histogram
static <O,T extends HistogramDataAggregator<C, HistogramVisualSet<T,O>.HistogramDataGroup, C> C> histogram(String name, HistogramDataAggregator<C, O> aggregator, HistogramVisualSet.ExtractValuePolicy extractValuePolicy, boolean cleanEmptyGroups) -
histogram
static <O,T extends HistogramDataAggregator<C, HistogramVisualSet<T,O>.HistogramDataGroup, C> C> histogram(String name, HistogramDataAggregator<C, O> aggregator, HistogramVisualSet.ExtractValuePolicy extractValuePolicy) -
histogram
static <T extends HistogramDataAggregator<String,T>.HistogramDataGroup> HistogramVisualSet<T,String> histogram(String name, org.apache.commons.math3.distribution.RealDistribution realDistribution, int barsCount) -
line
Creates an instance ofLineVisualSetwith the specified name and step interpolation from the providedITableFunction. The returned visual set is updated when the provided table function is updated itself.The following example demonstrates the usage of this method:
Composite parent = ...; var tableFunction = new IntervalTableFunction(); tableFunction.addInterval(0, 5, 5); tableFunction.addInterval(5, 10, 10); var lineChart = Charts.lineNumeric(parent); var lineVisualSet = VisualSets.line("Line plot", tableFunction); lineChart.getVisualSetContainer().addVisualSet(lineVisualSet);- create an interval table function that contains the data for the line plot;
- initialize the line chart with numeric X-Axis;
- create a visual set with the table function as an underlying data source;
- finally, add the visual set to the chart.

- Parameters:
name- name of the created visual settableFunction- table function which provides the data for the visual set- Returns:
- a new instance of
LineVisualSet
-
lineBar
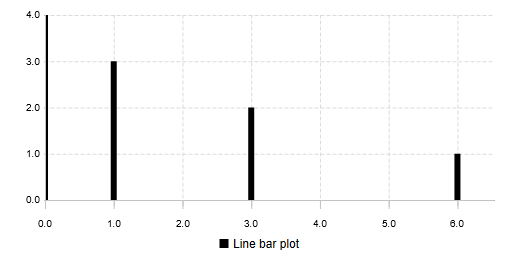
Creates an instance ofLineBarVisualSetwith the specified name and linear interpolation from the providedITimeStatistics. The returned visual set is updated when the provided time statistics instance is updated itself.The following example demonstrates the usage of this method:
Composite parent = ...; var timeStatistics = new TimeStatistics(1); timeStatistics.add(0, 4); timeStatistics.add(1, 3); timeStatistics.add(3.5, 2); timeStatistics.add(6, 1); var lineChart = Charts.lineNumeric(parent); var lineVisualSet = VisualSets.lineBar("Line bar plot", timeStatistics); lineChart.getVisualSetContainer().addVisualSet(lineVisualSet);- create an time statistics with granularity of 1 that contains the data for the bar plot;
- initialize the line chart with numeric X-Axis;
- create a visual set with the time statistics instance as an underlying data source;
- finally, add the visual set to the chart.
- Parameters:
name- name of the created visual settimeStatistics- time statistics instance which provides the data for the visual set- Returns:
- a new instance of
LineBarVisualSet
-
lineBar
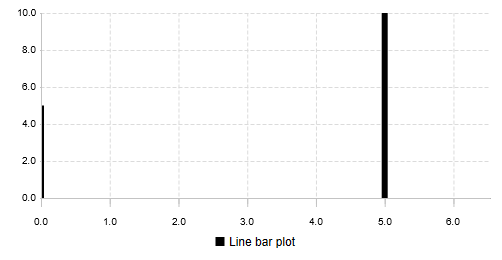
static LineBarVisualSet<Pair<Double,Double>> lineBar(String name, ITableFunction tableFunction, double granularity) Creates an instance ofLineBarVisualSetwith the specified name, linear interpolation, and specified x-axis granularity from the providedITableFunction. The returned visual set is updated when the provided time statistics instance is updated itself.The following example demonstrates the usage of this method:
Composite parent = ...; var tableFunction = new IntervalTableFunction(); tableFunction.addInterval(0, 5, 5); tableFunction.addInterval(5, 10, 10); var lineChart = Charts.lineNumeric(parent); var lineVisualSet = VisualSets.lineBar("Line bar plot", tableFunction, 5); lineChart.getVisualSetContainer().addVisualSet(lineVisualSet);- create an interval table function that contains the data for the line plot;
- initialize the line chart with numeric X-Axis;
- create a visual set with the table function instance as an underlying data source and granularity of 5 units;
- finally, add the visual set to the chart.
- Parameters:
name- name of the created visual settableFunction- table function which provides the data for the visual setgranularity- the distance between plotted data points- Returns:
- a new instance of
LineBarVisualSet
-
lineBar
Creates an instance ofLineBarVisualSetwith the specified name and linear interpolation from the providedITableFunction. The returned visual set is updated when the provided time statistics instance is updated itself.The bars are plotted with the distance of 1 x-axis unit. If a different granularity is needed, consider using
lineBar(String, ITableFunction, double)method.The following example demonstrates the usage of this method:
Composite parent = ...; var tableFunction = new IntervalTableFunction(); tableFunction.addInterval(0, 5, 5); tableFunction.addInterval(5, 10, 10); var lineChart = Charts.lineNumeric(parent); var lineVisualSet = VisualSets.lineBar("Line bar plot", tableFunction); lineChart.getVisualSetContainer().addVisualSet(lineVisualSet);- create an interval table function that contains the data for the line plot;
- initialize the line chart with numeric X-Axis;
- create a visual set with the table function instance as an underlying data source;
- finally, add the visual set to the chart.

- Parameters:
name- name of the created visual settableFunction- table function which provides the data for the visual set- Returns:
- a new instance of
LineBarVisualSet
-
line
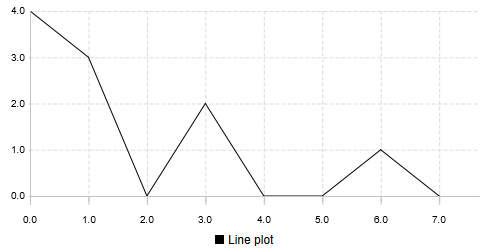
Creates an instance ofLineVisualSetwith the specified name from the providedITimeStatistics. Considers empty buckets of the time statistics as zeros. The returned visual set has a linear interpolation is updated when the provided table function is updated itself.The following example demonstrates the usage of this method:
Composite parent = ...; var timeStatistics = new TimeStatistics(1); timeStatistics.add(0, 4); timeStatistics.add(1, 3); timeStatistics.add(3.5, 2); timeStatistics.add(6, 1); var lineChart = Charts.lineNumeric(parent); var lineVisualSet = VisualSets.line("Line plot", timeStatistics); lineChart.getVisualSetContainer().addVisualSet(lineVisualSet);- create and populate an instance of time statistics that contains the data for the line plot;
- initialize the line chart with numeric X-Axis;
- create a visual set with the instance of time statistics as an underlying data source;
- finally, add the visual set to the chart.
- Parameters:
name- name of the created visual settimeStatistics- time statistics instance which provides the data for the visual set- Returns:
- a new instance of
LineVisualSet
-
line
static LineVisualSet<Pair<Double,Double>> line(String name, ITimeStatistics timeStatistics, boolean interpolateEmptyBuckets) Creates an instance ofLineVisualSetwith the specified name and interpolation rule for empty buckets, from the providedITimeStatistics. The returned visual set has a linear interpolation is updated when the provided table function is updated itself.The following example demonstrates the usage of this method:
Composite parent = ...; var timeStatistics = new TimeStatistics(1); timeStatistics.add(0, 4); timeStatistics.add(1, 3); timeStatistics.add(3.5, 2); timeStatistics.add(6, 1); var lineChart = Charts.lineNumeric(parent); var interpolatedVisualSet = VisualSets.line("Interpolate empty buckets", timeStatistics, true).setLineColor(Color.blue); var nonInterpolatedVisualSet = VisualSets.line("Do not interpolate empty buckets", timeStatistics, false).setLineColor(Color.red); lineChart.getVisualSetContainer().reset(List.of(interpolatedVisualSet, nonInterpolatedVisualSet));- create and populate an instance of time statistics that contains the data for the line plot;
- initialize the line chart with numeric X-Axis;
- create two visual sets with the instance of time statistics as an underlying data source: blue one with the interpolation, and red one without interpolation;
- finally, add the visual set to the chart.

- Parameters:
name- name of the created visual settimeStatistics- time statistics instance which provides the data for the visual setinterpolateEmptyBuckets- iftrue, then last non-empty bucket values will be used for empty buckets of theITimeStatistics. Iffalse, then empty buckets will be considered zeros.- Returns:
- a new instance of
LineVisualSet
-
cumulativeLine
static LineVisualSet<Pair<Double,Double>> cumulativeLine(String name, ITimeStatistics timeStatistics) -
line
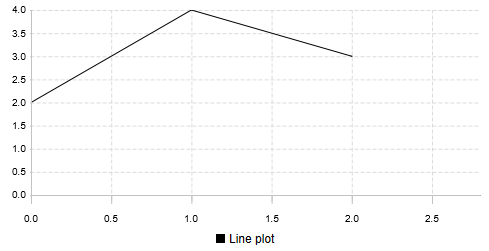
static LineVisualSet<Pair<Double,Double>> line(String name, List<Pair<Double, Double>> argumentValuePairs) Creates an instance ofLineVisualSetwith the specified name from the provided list of argument-value pairs (instancesPair) of Double values. The returned visual set has a linear interpolation.The following example demonstrates the usage of this method:
Composite parent = ...;
This code does the following:var listOfPairs = List.of(new Pair<>(0.0, 2.0), new Pair<>(1.0, 4.0), new Pair<>(2.0, 3.0));var lineChart = Charts.lineNumeric(parent); var lineVisualSet = VisualSets.line("Line plot", listOfPairs); lineChart.getVisualSetContainer().addVisualSet(lineVisualSet);- create and populate a list of pairs of Double values;
- initialize the line chart with numeric X-Axis;
- create a visual set with the list of pairs as an underlying data source;
- finally, add the visual set to the chart.
- Parameters:
name- name of the created visual setargumentValuePairs- list of argument-value pairs used as data for the visual set- Returns:
- a new instance of
LineVisualSet
-
piecewisePolyline
static PiecewisePolylineVisualSet piecewisePolyline(String name, Supplier<PiecewiseFunction> piecewiseFunctionExtractor, Supplier<Pair<Double, Double>> displayedRangeExtractor, Supplier<Double> axisLengthInPixelsExtractor) Constructs a PiecewiseLineVisualSet with given name, piecewiseFunction extractor and discretization rule extractors.- Parameters:
name- visual set name is used to sort and name the visual sets on the chartpiecewiseFunctionExtractor- data elements list provider. The provider is invalidated every time the chart is being redrawndisplayedRangeExtractor- a function that specifies the rule for extracting a current displayed range on plotaxisLengthInPixelsExtractor- a function that specifies the rule for extracting an actual plot X-axis length in pixels
-
piecewisePolyline
static PiecewisePolylineVisualSet piecewisePolyline(String name, Supplier<PiecewiseFunction> piecewiseFunctionExtractor, Supplier<Double> currentArgumentExtractor, Supplier<Pair<Double, Double>> displayedRangeExtractor, Supplier<Double> axisLengthInPixelsExtractor) Constructs a PiecewiseLineVisualSet with given name, piecewiseFunction extractor and discretization rule extractors.- Parameters:
name- visual set name is used to sort and name the visual sets on the chartpiecewiseFunctionExtractor- data elements list provider. The provider is invalidated every time the chart is being redrawncurrentArgumentExtractor- a function that specifies the rule for extracting a current argument shown on plot. When working with simulation in most cases a model.time() is used as a max argument. NaN (not considered by visual set) by default.displayedRangeExtractor- a function that specifies the rule for extracting a current displayed range on plotaxisLengthInPixelsExtractor- a function that specifies the rule for extracting an actual plot X-axis length in pixels
-
line
static LineVisualSet<Pair<Double,Double>> line(String name, Supplier<List<Pair<Double, Double>>> argumentValuePairs) Creates an instance ofLineVisualSetwith the specified name from the provided supplier of list of argument-value pairs (instancesPair) of Double values. The returned visual set has a linear interpolation.The following example demonstrates the usage of this method:
Composite parent = ...;
This code does the following:var listOfPairs = List.of(new Pair<>(0.0, 2.0), new Pair<>(1.0, 4.0), new Pair<>(2.0, 3.0));var lineChart = Charts.lineNumeric(parent); var lineVisualSet = VisualSets.line("Line plot", () -> listOfPairs); lineChart.getVisualSetContainer().addVisualSet(lineVisualSet);- create and populate a list of pairs of Double values;
- initialize the line chart with numeric X-Axis;
- create a visual set with a supplier of the list of pairs as an underlying data source;
- finally, add the visual set to the chart.
- Parameters:
name- name of the created visual setargumentValuePairs- supplier of a list of argument-value pairs used as data for the visual set- Returns:
- a new instance of
LineVisualSet
-
waterfall
static <T> WaterfallVisualSet<T> waterfall(String name, List<T> elements, Function<T, Double> valueExtractor, Function<T, String> textExtractor, Function<T, WaterfallVisualSet.ElementType> typeExtractor) Constructs an instance ofWaterfallVisualSetwith the specified parameters. Waterfall visual set extendsBarVisualSet, can be shown on bar charts and visualizes data in a waterfall format. This format is designed to display cumulative effect of sequentially introduced positive or negative values.The following example demonstrates the usage of this method:
 Composite parent = ...
 // Create a bar chart with stack bars layout
 var barChart = Charts.bar(parent);
 // Do not show the chart's legend
 barChart.getLegend().setVisible(false);
 // Define the type of data elements
 record Element(String name, boolean isAbsolute, double value) { }
 // Fill the list of data
 var data = List.of(    new Element("Baseline", true, 100),
                                                new Element("Improvement 1", false, 20),
                                                new Element("Improvement 2", false, 5),
                                                new Element("Subtotal 1", true, 125),
                                                new Element("Degradation 1", false, -10),
                                                new Element("Total", true, 115));
 // Create the waterfall visual set
 var waterfallVisualSet = VisualSets.waterfall(
                        "Waterfall", data,
                        Element::value,
                        Element::name,
                        e -> e.isAbsolute() ? ABSOLUTE_VALUE : DELTA);
 // Add the visual set to the chart's visual set container
 barChart.getVisualSetContainer().addVisualSet(waterfallVisualSet);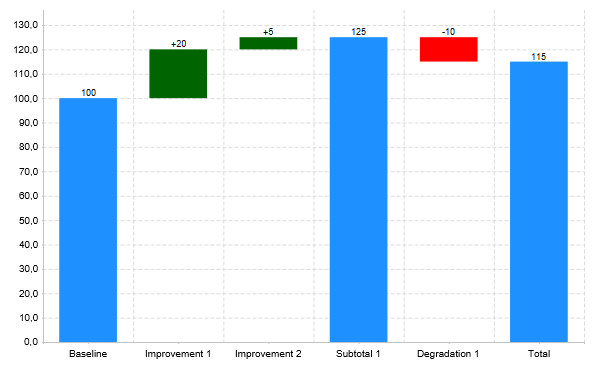
- Parameters:
name- the name of the visual setelements- the list of elements to visualizevalueExtractor- a function to extract the value from each elementtextExtractor- a function to extract the text to be shown on the X-Axis for each elementtypeExtractor- a function to determine theWaterfallVisualSet.ElementTypeof each element - must it be shown as an absolute value or as a delta from from the previous value.
-
boxAndWhisker
static <T> BoxAndWhiskerVisualSet<T> boxAndWhisker(String name, Supplier<List<T>> elements, Function<T, String> textExtractor, Function<T, DistributionStatistics> statisticsExtractor) Creates aBoxAndWhiskerVisualSetwith the specified name, data elements, and extractors. Uses the default display modeQUARTILES_AND_RANGE.- Type Parameters:
T- the type of the elements in the visual set- Parameters:
name- the name of the visual setelements- the supplier providing the list of elementstextExtractor- function to extract the display name for each elementstatisticsExtractor- function to extract distribution statistics for each element- Returns:
- a configured instance of
BoxAndWhiskerVisualSet
-
boxAndWhisker
static <T> BoxAndWhiskerVisualSet<T> boxAndWhisker(String name, Supplier<List<T>> elements, Function<T, String> textExtractor, Function<T, DistributionStatistics> statisticsExtractor, VisualSets.BoxAndWhiskerDisplayMode mode) Creates aBoxAndWhiskerVisualSetwith the specified name, data elements, extractors, and display mode.- Type Parameters:
T- the type of the elements in the visual set- Parameters:
name- the name of the visual setelements- the supplier providing the list of elementstextExtractor- function to extract the display name for each elementstatisticsExtractor- function to extract distribution statistics for each elementmode- the display mode for rendering the box and whisker intervals- Returns:
- a configured instance of
BoxAndWhiskerVisualSet
-
mapping
-