Class Charts
java.lang.Object
com.amalgamasimulation.charts.swt.Charts
-
Constructor Summary
Constructors -
Method Summary
Modifier and TypeMethodDescriptionstatic BarChartbar(org.eclipse.swt.widgets.Composite parent) Constructs a Bar Chart with a set of default parameters: no title, stackBarsLayout, etc.static BarChartbar(org.eclipse.swt.widgets.Composite parent, BarsLayout barsLayout) Constructs a Bar Chart with a set of default parameters: no title, stackBarsLayout, etc.static TimeGanttChartgantt(org.eclipse.swt.widgets.Composite parent) Constructs a Gantt Chart with a set of default parameters: no title, dailytime units, begin displayed range is equals to 7 days, bar height fraction is equal to 1.static TimeGanttChartgantt(org.eclipse.swt.widgets.Composite parent, ChronoUnit timeUnit) Constructs a Gantt Chart with given chrono unit and a set of default parameters:no title, begin displayed range is equals to 7 days, bar height fraction is equal to 1.static HeatmapChartheatmap(org.eclipse.swt.widgets.Composite parent) Constructs a Heatmap Chart with no title.static HistogramCharthistogram(org.eclipse.swt.widgets.Composite parent) Constructs a Histogram Chart with a set of default parameters: no title, stackBarsLayout, etc.static TimeLineChartline(org.eclipse.swt.widgets.Composite parent) Constructs a Line Chart with given time units and a set of default parameters: no title, begin displayed range is equals to 7 days.static TimeLineChartline(org.eclipse.swt.widgets.Composite parent, ChronoUnit timeUnit) Constructs a Line Chart with given title and time units.static NumericLineChartlineNumeric(org.eclipse.swt.widgets.Composite parent) Constructs a Line Chart with a set of default parameters: no title, default begin displayed range size etc.static voidsyncCharts(Chart<?, ?> chart, com.amalgamasimulation.desktop.utils.MessageManager messageManager, BooleanSupplier syncSupplier, BiConsumer<Double, Double> onPeriodChangeHandler, String adjustSimulationPlotsMessage, String setVerticalGuideMessage, String hideVerticalGuideMessage) static voidsyncCharts(Chart<?, ?> chart, com.amalgamasimulation.desktop.utils.MessageManager messageManager, Supplier<Boolean> syncSupplier, BiConsumer<Double, Double> onPeriodChangeHandler, String adjustSimulationPlotsMessage, String setVerticalGuideMessage, String hideVerticalGuideMessage)
-
Constructor Details
-
Charts
public Charts()
-
-
Method Details
-
gantt
Constructs a Gantt Chart with a set of default parameters: no title, dailytime units, begin displayed range is equals to 7 days, bar height fraction is equal to 1.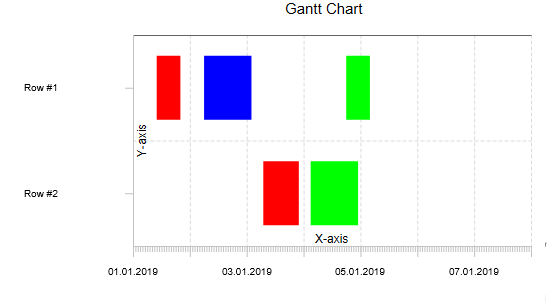
- Parameters:
parent- theCompositeon which the chart is placed- Returns:
- a new Gantt Chart with a set of default parameters
-
heatmap
Constructs a Heatmap Chart with no title.
- Parameters:
parent- theCompositeon which the chart is placed- Returns:
- a new Heatmap Chart with no title
-
gantt
Constructs a Gantt Chart with given chrono unit and a set of default parameters:no title, begin displayed range is equals to 7 days, bar height fraction is equal to 1.- Parameters:
parent- theCompositeon which the chart is placedtimeUnit- chart horizontal axis time units- Returns:
- a new Gantt Chart with given chrono unit and a set of default parameters
-
line
Constructs a Line Chart with given title and time units. Begin displayed range is equals to 7 days and title is not set.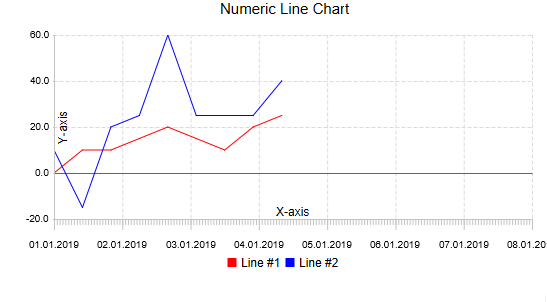
- Parameters:
parent- theCompositeon which the chart is placedtimeUnit- chart horizontal axis time units- Returns:
- a new Line Chart with given title and time units
-
line
Constructs a Line Chart with given time units and a set of default parameters: no title, begin displayed range is equals to 7 days.- Parameters:
parent- theCompositeon which the chart is placed- Returns:
- a new Line Chart with given time units and a set of default parameters
-
lineNumeric
Constructs a Line Chart with a set of default parameters: no title, default begin displayed range size etc.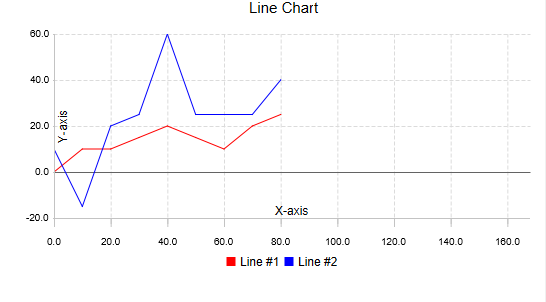
- Parameters:
parent- theCompositeon which the chart is placed- Returns:
- a new Line Chart with a set of default parameters
-
bar
Constructs a Bar Chart with a set of default parameters: no title, stackBarsLayout, etc.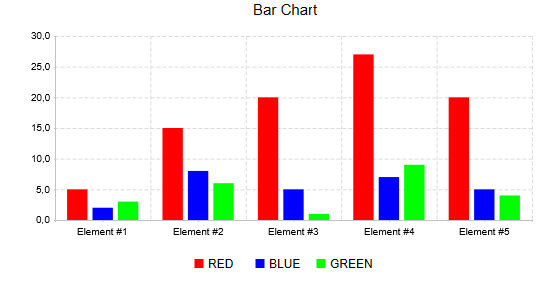
- Parameters:
parent- theCompositeon which the chart is placed- Returns:
- a new Bar Chart with a set of default parameters
-
bar
Constructs a Bar Chart with a set of default parameters: no title, stackBarsLayout, etc.- Parameters:
parent- theCompositeon which the chart is placedbarsLayout- a type of arranging different categories within different Bar Chart data-elements- Returns:
- a new Bar Chart with a set of default parameters
-
histogram
Constructs a Histogram Chart with a set of default parameters: no title, stackBarsLayout, etc.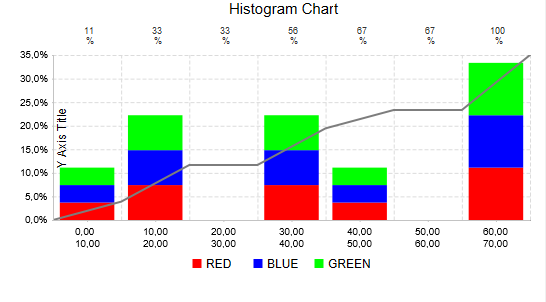
- Parameters:
parent- theCompositeon which the chart is placed- Returns:
- a Histogram Chart with a set of default parameters
-
syncCharts
-
syncCharts
public static void syncCharts(Chart<?, ?> chart, com.amalgamasimulation.desktop.utils.MessageManager messageManager, BooleanSupplier syncSupplier, BiConsumer<Double, Double> onPeriodChangeHandler, String adjustSimulationPlotsMessage, String setVerticalGuideMessage, String hideVerticalGuideMessage)
-